Introduction
Motor neurone disease (MND) is a rare but devastating illness which leads to progressive paralysis and eventual death. Although rare, many patients are both aware and fearful of it [1]. MND is a progressive degenerative disease of the motor nerve cells of the brain and spinal cord. Neurons control muscle movement of all kinds of physical activities. When the nerves become inactive, muscles gradually weaken leading to paralysis and impaired speaking as well. However, it has been observed that the senses, intellect or memory remains unaffected in most of the cases. Though MND is still incurable, but through proper and continuous treatment several symptoms can be controlled.
Myopathy (MYO) is a sign of pathology with widely varying etiologies, including congenital or inherited, idiopathic, infectious, metabolic, inflammatory, endocrine, and drug-induced or toxic. The primary symptom of this disorder is muscle weakness due to dysfunction of muscle fiber, while it can include other symptoms like muscle cramps, stiffness, and spasm also [2].
Neuropathy (NEURO), generally known as damage to nerves, may be caused either by diseases or trauma to the nerve or as a component of systemic illness.
An electromyography (EMG) signal is obtained by measurement of the electrical activity of a muscle during contraction, and reflects the electrical depolarization of excitable muscle fiber membranes that create electrical signals called muscle fibers potentials (MFPs) [3]. EMG is of two types: surface EMG (SEMG), and intramuscular EMG [4]. SEMG and intramuscular EMG signals are recorded by non-invasive electrodes and invasive electrodes, respectively. These days, surface-detected signals are preferably used to obtain information about the time or intensity of superficial muscle activation [5]. The EMG signal has been widely applied in fatigue studies [6-10] rehabilitation and prosthetic control [11-15], neurology, as a means in clinical diagnosis [16,17], and even in EMG augmented speech recognition [18].
Several complex dynamical systems found in nature are characterized by a set of nonlinear differential equations. The reason for the chaotic behavior of these complex systems is attributed to nonlinearity [19]. Physiological systems are also complex systems involving several nonlinearities [20,21]. Myopathies (MYO), Neuropathies (NEURO) and Motor Neuron Disease (MND) also have such inherent nonlinear character.
Different linear analysis techniques have been applied to describe the characteristics of EMG signals. Time-domain features have been studied by zero crossings and root mean square (RMS) [15] techniques; stochastic features by autoregressive model coefficients [22], cepstral coefficients [11], mean frequency and median frequency (MDN) [6,23] etc. But there are certain limitations with these methods as realized by the scientists. Like every other system found in nature, EMG signals are also of complex character, as they are composed of many subsystems which are strongly correlated to each other, but not in a linear fashion. Conventional linear techniques like amplitude, root mean square or Fourier analysis cannot provide detail information about these subsystems. The development of nonlinear methods has significantly helped in studying complex nonlinear systems in detail by providing accurate and precise information about them such as in studying the multi-resolution features of EMG signals, wavelet coefficients have high level of accuracy [12]. Recurrence quantification analysis (RQA) provides additional information on the underlying motor strategies [24,25], hidden rhythms [26] or fatigue [27,28].
With the development of nonlinear dynamics it is now very clear that simple nonlinear systems exhibit highly complex [29-34] and chaotic behavior as they are extremely sensitive to initial conditions, since any perturbation, no matter how minute, will forever alter the future of the systems. In complex signal there exists self-similarity phenomenon, in that there is a smaller scale structure that resembles the larger scale structure in complex medical signals such as EMG, EEG (electroencephalography) and ECG (electrocardiograph) signals [33]. Fractals exhibit this selfsimilar property [35]. The source of SEMG is a set of similar action potentials originating from different locations in the muscles. Because of the self - similarity of the action potentials that are the source of the SEMG recordings over a range of scales, SEMG is expected to have fractals properties.
Fractals refer to objects or signal patterns that have fractional dimension. The measured property of the fractal process is scale dependant and has self-similar variations in different time scales. Fractal dimension (FD) is a measure of the fractal properties of any structure. Fractals can be classified into two categories: monofractals and multifractals. Monofractals are those whose scaling properties are the same in different regions of the system and multifractals are more complicated self-similar objects that consist of differently weighted fractals with different non-integer dimensions. Thus the fundamental characteristic of multifractality is the scaling properties may be different in different regions of the systems [36].
Several researchers applied different nonlinear methods to characterize the geometry and fractal properties of the EMG signals [37-47]. Some authors have directly applied geometrical methods e.g., Katz method [48] and box-counting method [49] on the EMG signal interference pattern to acquire an estimate of the fractal dimension.
Other nonlinear methods such as nonlinear entropy analysis and fractal analysis have been proposed to analyze SEMG signals for extracting information that can detect the changes in different muscle statuses. Zhao Jing-Dong et al. extracted sample entropy and wavelet transform coefficients from three channels of SEMG signals for classifying six fingers movements [50]. Naik et al. used the fractal dimension features for identifying finger movements [51]. In a study Dang et al. showed EMG to be a powerful tool for investigating the relationship between jaw imbalance and the loss of arm strength with Higuchi Fractal dimension (HFD) analysis [52]. Zhang et al. observed, though the traditional time-domain and frequency-domain analyzing methods used in EMG pattern recognition have a satisfactory capability to track muscular changes, but as far as detection of critical features of SEMG signals during transient human movements are concerned, nonlinear methods like nonlinear entropy analysis or fractal analysis are more reliable than the conventional linear analysis methods [53]. Naeem et al. used a combination of linear and nonlinear techniques to estimate their ability to recognize uterine EMG records of term and preterm deliveries using artificial neural network [54]. In another work Patidar et al. applied the back propagation neural network classifier for classification of myopathy patients and healthy subjects with the help of EMG signal [3]. Lei and Meng, investigated the stochastic, deterministic and chaotic behavior of SEMG signals with several nonlinear techniques such as surrogate data method, VWK model method, chaotic analysis method, symplectic geometry method and fractal analysis method. They observed the necessity of multifractal analysis, as it was found very difficult to describe SEMG using single fractal dimension [55]. Way back in 2007 Gang et al. [56] observed SEMG signals from biceps brachii on the skin surface of right forearm of human subjects’ characterized multifractality during a static contraction applying multifractal analysis technique as an indicator for assessing muscle fatigue. Several other authors have also extensively analyzed the classical (mono-) fractal aspects [57-61] in the domain of force of contraction of different muscles [62].
In this paper we have proposed multifractal detrended fluctuation analysis (MF-DFA) method to study the multifractal properties of EMG signals of three human subjects of which one contains healthy EMG data and the other two MYO and NEURO data respectively. We may mention that we do not have access to any other data of EMG time series.
Kantelhardt et al. introduced multifractal detrended fluctuation analysis (MF-DFA) as a generalization of the standard DFA [63]. For the study of multifractal scaling behavior of various nonstationary time series, MF-DFA has been applied quite successfully in different fields of science and engineering [64-70]. MF-DFA is a nonlinear analysis technique, the application of which on a given set of data provides information about any evidence of selfsimilarity or persistence in the series [71]. MF-DFA allows a global detection of multifractal behavior, while the WTMM method is suited for the local characterization of the scaling properties of signals. Moreover the MFDFA does not require a big effort in programming but provides reliable results [72].
Description of the data
We obtained the data from https://physionet.org/physiobank/ database/emgdb/
Data were collected with a Medelec Synergy N2 EMG Monitoring System (Oxford Instruments Medical, Old Woking, United Kingdom). EMG data from: 1) A 44-year-old man without history of neuromuscular disease; 2) A 57-year-old man with myopathy due to longstanding history of polymyositis, treated effectively with steroids and low-dose methotrexate; and 3) A 62-year-old man with chronic low back pain and neuropathy due to a right L5 radiculopathy. The data were recorded at 50 KHz and then down-sampled to 4 KHz. During the recording process two analog filters were used: A 20 Hz high-pass filter and a 5K Hz low-pass filter. The data were further divided into five equal sets for each subject.
Method of analysis
We have performed a multifractal analysis of the EMG recordings of three human subjects, one healthy, one with myopathy and one with neuropathy respectively using methodology of Kantelhardt et al. [63].
Let us consider x(i) for i =1, ............, N, be a non-stationary time series of length N. The mean of the above series is given by
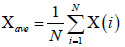 (1)
(1)
Assuming x(i) as the increments of a random walk process around the average, the trajectory can be obtained by integration of the signal.
 (2)
(2)
The level of measurement noise present in experimental records and the finite data are also reduced by the integration thereby dividing the integrated time series into Ns non-overlapping bins, where Ns = int(N/S) and where s is the length of the bin. As N is not a multiple of s, a small portion of the series is left at the end.
Again, to include that left part, the entire process is repeated in a similar way starting from the opposite end, leaving a small portion at the beginning. Hence, 2Ns bins are obtained altogether and for each bin least-square fit of the series is done followed by determination of the variance.
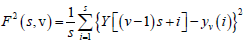 (3)
(3)
For each bin ν, ν =1 ........ Ns and
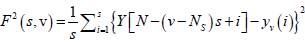 (4)
(4)
For ν = Ns + 1........, 2 Ns, where Yv(i) is the least square fitted value in the bin ν. In our research work we have performed a least square linear fit (MFDFA -1). The study can also be extended to higher orders by fitting quadratic, cubic, or higher order polynomials.
The qth order fluctuation function Fq(s) is obtained after averaging over 2 Ns, bins,
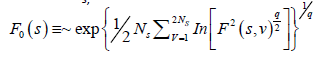 (5)
(5)
where q is an index which can take all possible values except zero, as the factor 1/q becomes infinite with zero value. The procedure can be repeated by varying the value of s. With the increase in the value of s Fq (s) , increases and for the long range power correlated series Fq (s) shows power law behavior,

If such a scaling exists, In Fq will depend linearly on s with slope h(q). In general, the exponent h(q) depends on q. For a stationary time series, h(2) is identical with the Hurst exponent H. h(q) is said to be the generalised exponent. The value of h(0) cannot be obtained directly, because Fq blows up at q = 0. Fq cannot be obtained by normal averaging procedure; instead a logarithmic averaging procedure is applied.
 (6)
(6)
A monofractal time series is characterized by unique h(q) for all values of q. If small and large fluctuations scale differently, then h(q) will depend on q, or in other words the time series is multifractal. Kantelhardt et al. have explained that the values of h(q) for q < 0 will be larger than that for q > 0 [73].
The generalized Hurst exponent h(q) of MFDFA is related to the classical scaling exponent τ(q) by the relation,
τ (q) = qh(q) −1 (7)
a monofractal series with long range correlation is characterized by linearly dependent q- order exponent τ(q) with a single Hurst exponent H. Multifractal signals have multiple Hursts exponent and τ(q) depends nonlinearly on q [74]. The singularity spectrum f(α) is related to τ(q) by Legendre transform [75].
α = h(q) + qh(q) (8)
f (α ) = q [α − h(q)] +1 (9)
In general, the singularity spectrum quantifies the long range correlations property of the time series [76]. The multifractal spectrum is capable of providing information about the relative importance of various fractal exponents in the time series, e.g., the width of the spectrum denotes range of exponents. A quantitative characterization of the spectra can be done by leastsquares fitting it to quadratic function [77] around the position of maximum α0,
 (10)
(10)
where C is a additive constant, C = f(α0) =1; B indicates the asymmetry of the spectrum, and zero for a symmetric spectrum. The width of the spectrum can be obtained by extrapolating the fitted curve to zero. Width W is defined as W = α1 – α2 with f(α1) = f(α2) = 0. It has been proposed by some workers [78] that the width of the multifractal spectrum is a measure of the degree of multifractality. Singularity strength or Holder exponent α and the dimension of subset series f(α) can be obtained from reln.9 and 10. For a monofractal series, h(q) is independent of q. Hence from relation 9 and 10 it is evident that there will be a unique value of α and f(), the value of α being the generalized Hurst exponent H and the value of f(α) being 1. Hence the width of the spectrum will be zero for a monofractal series. The more the width, the more multifractal is the spectrum.
The autocorrelation exponent γ can be estimated from the relation given below [79,80]:
γ = 2 − 2(h)(q = 2) (11)
For uncorrelated or short-range correlated data, h(2) is expected to have a value 0.5 while a value greater than 0.5 is expected for long-range correlations. Therefore for uncorrelated data, γ has a value 1 and the lower the value the more correlated is the data.
Superiority of MFDFA over other conventional methods
A time series containing apparent irregularities can be best described with nonlinear scaling analysis. MFDFA, in comparison with the conventional methods such as Fourier analysis, Detrended Fluctuation Analysis (DFA), Detrended Moving Average (DMA), Backward Moving Average (BMA), Modified Detrended Fluctuation Analysis (MDFA), Continuous DFA (CDFA), Wavelet Analysis etc., has achieved the highest degree of precision. It is a very rigorous and robust technique and can be implemented with lesser effort in computer programming as compared to conventional DFA, since it does not require the modulus maxima procedure. Many researchers in this domain have recommended MFDFA due to its better performance than other conventional methods in the analysis of multifractality in both stationary as well as non-stationary time series [63,81,82]. Oswiecimka et al. have established the superiority of MFDFA over other techniques, especially over the most popular one, the Wavelet Transform Modulus Maxima (WTMM) in terms of reliable applications [83].
Certain limitations have also been identified in MFDFA method. Mainly, where a large amount of data is missing or removed due to artifacts, the problem may arise in the identification of correlation properties of real data. However, Ma et al. [84] observed that the major findings are not significantly disturbed even with loss of data.
Results
The non-stationary times series of EMG data of healthy, myopathy and neuropathy respectively recorded in three human subjects are analyzed following the method described above.
Multifractal analysis was employed for each set. The data was transformed to obtain the integrated signal. This process is effective in reducing noise in the data. The integrated time series was divided to Ns bins, where Ns = int(N/s), N is the length of the series. The qth order fluctuation function Fq(s) for q = -10 to +10 in steps of 1 was determined.
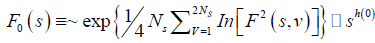
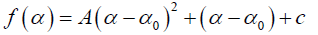
Figure 1 depicts the linear dependence of lnFq on lns suggesting scaling behavior for the healthy subjects. Figure 2 and Figure 3 also depict the same scaling behavior for myopathy and neuropathy patients respectively.
Figure 1: lnFq vs. lns for a particular set of EMG signal of healthy subject.
Figure 2: lnFq vs. lns for a particular set of EMG signal of myopathy patient.
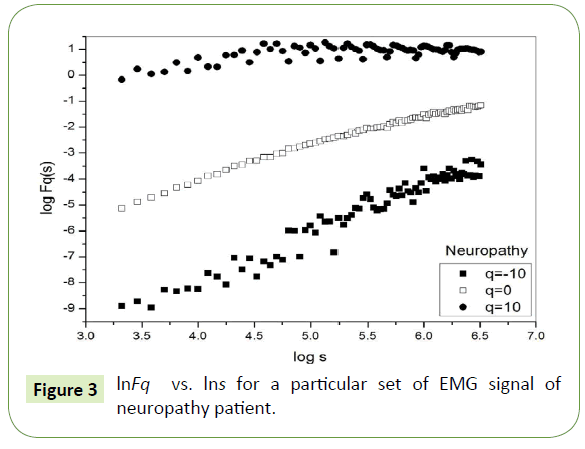
Figure 3: lnFq vs. lns for a particular set of EMG signal of neuropathy patient.
The slope of linear fit to ln Fq(s) versus lns plots gives the values of h(q). The values of τ(q) were also determined. As we have mentioned earlier, nonlinear dependence of on (q) on q suggests multifractality, whereas for a monofractal series τ(q) depends linearly on q. The values of h(q) and τ(q) of all the EMG signals are depicted in Figures 4 and 5 respectively.
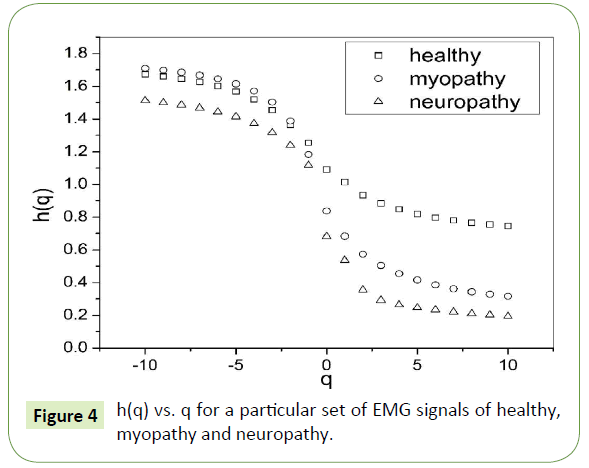
Figure 4: h(q) vs. q for a particular set of EMG signals of healthy, myopathy and neuropathy.
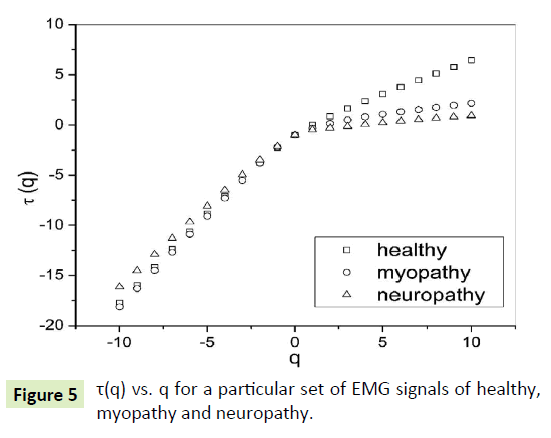
Figure 5: τ(q) vs. q for a particular set of EMG signals of healthy, myopathy and neuropathy.
The nonlinear dependence of τ(q) on q and the dependence of h(q) on q gives evidence for the multifractality of the EMG signals. Figure 4 also depicts that the degree of dependence of h(q) on q, or in other words, the degree of multifractality is different in different cases.
Table 1 is formed with the values obtained from Figure 4 where we can see that for q = 2 the generalized Hurst exponent h(q) of all the EMG signals of healthy and myopathy subjects are greater than 0.5 which means that long range correlation and persistent properties exist in all the sets. For neuropathy, h(q) is less than 0.5, which indicates the existence of anti-persistent properties in all the sets.
| Order q |
Generalized Hurst Exponent h(q) |
| Healthy |
Myopathy |
Neuropathy |
| -10 |
1.67 |
1.71 |
1.51 |
| -9 |
1.66 |
1.70 |
1.50 |
| -8 |
1.65 |
1.69 |
1.49 |
| -7 |
1.63 |
1.67 |
1.47 |
| -6 |
1.60 |
1.65 |
1.44 |
| -5 |
1.57 |
1.61 |
1.41 |
| -4 |
1.52 |
1.57 |
1.37 |
| -3 |
1.45 |
1.50 |
1.32 |
| -2 |
1.36 |
1.39 |
1.24 |
| -1 |
1.26 |
1.18 |
1.12 |
| 0 |
1.09 |
0.84 |
0.68 |
| 1 |
1.01 |
0.68 |
0.54 |
| 2 |
0.93 |
0.57 |
0.36 |
| 3 |
0.88 |
0.51 |
0.29 |
| 4 |
0.85 |
0.46 |
0.26 |
| 5 |
0.82 |
0.42 |
0.25 |
| 6 |
0.80 |
0.39 |
0.23 |
| 7 |
0.78 |
0.36 |
0.22 |
| 8 |
0.77 |
0.34 |
0.21 |
| 9 |
0.75 |
0.33 |
0.20 |
| 10 |
0.75 |
0.32 |
0.19 |
Table 1: Values of h(q) corresponding to q for a particular set of EMG signals of healthy, myopathy and neuropathy subjects.
A quantitative determination of the degree of multifractality can also be done from the multifractal spectrum. Ashkenazy et al. have associated the width of the multifractal spectrum (f(α) versus α) with the degree of multifractality [78]. Figure 6 shows the multifractal spectrum of healthy, myopathy and neuropathy EMG signals.
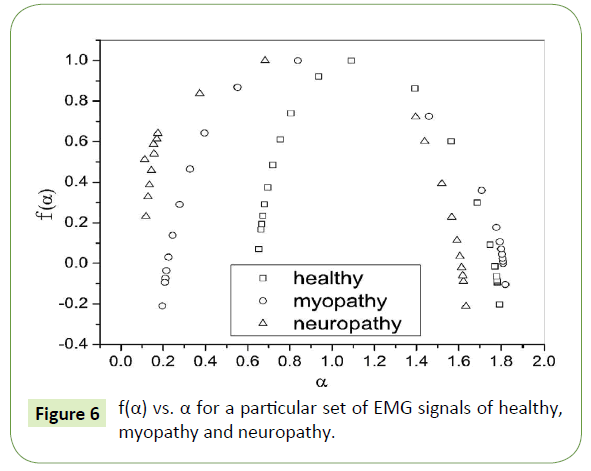
Figure 6: f(α) vs. α for a particular set of EMG signals of healthy, myopathy and neuropathy.
In Table 2 the values of multifractal width w obtained by fitting the multifractal spectrums to Eq. (8) are listed, where we can observe that the multifractal widths in five sets of all the three healthy, myopathy and neuropathy EMG signals are different ranging from as low as 1.144 to as high as 1.257, from 1.507 to 1.605 and from 1.655 to 1.991 respectively giving a clear indication of increasing complexity from healthy subject to neuropathy subject.
| Set |
Multifractal Width (w) |
| Healthy |
Myopathy |
Neuropathy |
| 1 |
1.161 ± 0.042 |
1.605 ± 0.078 |
1.655 ± 0.140 |
| 2 |
1.146 ± 0.041 |
1.583 ± 0.077 |
1.848 ± 0.103 |
| 3 |
1.257 ± 0.026 |
1.598 ± 0.087 |
1.855 ± 0.105 |
| 4 |
1.230 ± 0.050 |
1.507 ± 0.078 |
1.991 ± 0.078 |
| 5 |
1.144 ± 0.041 |
1.598 ± 0.073 |
1.813 ± 0.082 |
Table 2: Values of w for all the five sets of EMG signals of healthy, myopathy and neuropathy subjects.
From Table 3 we can observe that the value of auto-correlation exponent γ for set 5 of the healthy person is 0.035 which indicates a high degree of correlation as we know lower the value of higher is the degree of correlation. Whereas for the same set, for myopathy patient γ is quite high with a close approach to 1,indicating a very less autocorrelation and for neuropathy patient it is greater than 1 which implies there is no correlation at all.
| Set |
Autocorrelation Exponent (γ) |
| Healthy |
Myopathy |
Neuropathy |
| 1 |
0.132 ± 0.004 |
0.852 ± 0.010 |
1.288 ± 0.007 |
| 2 |
0.075 ± 0.006 |
0.842 ± 0.011 |
1.462 ± 0.010 |
| 3 |
0.069 ± 0.005 |
0.793 ± 0.009 |
1.442 ± 0.009 |
| 4 |
0.262 ± 0.004 |
0.73 ± 0.010 |
1.459 ± 0.009 |
| 5 |
0.035 ± 0.005 |
0.763 ± 0.010 |
1.431 ± 0.009 |
Table 3: Values of γ for all the five sets of EMG signals of healthy, myopathy and neuropathy subjects.
Discussion
Little work has been done on the analysis of EMG data with nonlinear techniques. Gang et al. reported a work [56] which aimed to study muscle fatigue during static contraction. Using a multifractal method developed by Chhabra and Jensen [85] they showed multifractility of SEMG signals. They observed the area of the multifractal spectrum of the SEMG signals to increase significantly during muscle fatigue. Thus they concluded that the area of the multifractal spectrum could then be used as an assessor of muscle fatigue which is more sensitive than the single characteristic frequency such as the median frequency (MDF) or mean frequency (MNF) of the power spectral density (PSD) which was a then popular method of estimating fatigue [86,87]. They also opined that the large area of SEMG multifractal singularity spectrum reflects the strengthened activity of the nervous system of the body in the process of muscle fatigue [86]. In another study Talebinejad et al. [88] used a bi-phase power spectrum method (BPSM) for fractal analysis of SEMG signals and also included an algorithm for extraction of fractal indicators (FIs). BSPM was evaluated for force and joint angle and the changes that reflect in EMG signals were demonstrated with the help of FIs. They also compared BSPM with geometrical techniques and the 1/fα approach for fractal analysis of electromyography signals and concluded that BPSM provides reliable information, as it consists of components which are capable of sensing force and joint angle effects separately, which could be used as complementary information for confounded conventional measures [88].
However as elaborated earlier Oswiecimka et al. have established the superiority of MFDFA over other techniques, especially the Wavelet Transform Modulus Maxima (WTMM) in terms of reliable applications [83]. Compared to other conventional methods MFDFA has reached the highest precision in scaling analysis. Thus it is considered a rigorous and robust tool for assessing correlation in nonlinear time series. Some other authors too have advocated the better performance of MFDFA than other multifractal analyses methods [63,81,82] as it can detect multifractality in both stationary as well as non-stationary time series.
Conclusion
Using MF-DFA in our work we have been able to distinguish the EMG signals of healthy, myopathy and neuropathy subjects effectively with the help of two parameters the multifractal width (w) and auto-correlation exponent (γ). Not only we observed different degree of multifractility of the EMG signals of healthy, myopathy and neuropathy subjects but we have also observed the significant variation in degree of auto-correlation for all the three subjects where subject with neuropathy shows no correlation at all. Thus the present study proposes a novel, rigorous method of assessment of myopathy and neuropathy using EMG time series from a different perspective and any EMG data available may be analyzed using the method for diagnosis and prognosis of myopathy and neuropathy and even early detection of motor neuron disease.
Acknowledgement
We would like to acknowledge “PhysioNet”, from where we have obtained the data (https://physionet.org/physiobank/database/ emgdb/).
Competing and Conflicting Interests
The authors declare that the research was conducted in the absence of any commercial or financial relationships that could be construed as a potential conflict of interest.
Author Agreement
We do hereby declare that this work has not been previously published elsewhere. Upon acceptance we assign Journal of Neurology and Neuroscience the right to publish and distribute the manuscript in part or in its entirety. We also agree to properly credit ‘Journal of Neurology & Neuroscience’ as the original place of publication. We hereby grant ‘Journal of Neurology and Neuroscience’ full and exclusive rights to the manuscript, all revisions, and the full copyright.
20928
References
- McDermott CJ, Shaw PJ (2008) Diagnosis and management of motor neurone disease. BMJ 336: 658-662.
- Bethel CA (2016) Myopathies: Practice essentials, background and pathophysiology. Medscape reference drugs, diseases and procedures.
- Patidar M, Jain N, Parikh A (2013) Classification of normal and myopathy EMG signals using BP neural network. Int J Comp App 69: 0975-8887.
- Farina D, Negro F (2012) Accessing the neural drive to muscle and translation to neurorehabilitation Technologies. IEEE Rev Biomed Eng 5: 3-14.
- Merletti R, De Luca CJ (1989) New techniques in surface electromyography. Computer Aided Electromyography and Expert Systems. In: Desmedt JE (Ed) Elsevier, Amsterdam, The Netherlands, New York, NY, USA, Oxford, UK 2: 115-124.
- Gerdle B, Eriksson N (1990) The behavior of mean power frequency of the surface electromyogram in Biceps brachii with increasing force and during fatigue with special regard to electrode distance. J Electromyograph Neurophysiol 30: 483-489.
- MacIsaac D, Englehart K, Parker P, Rogers D (2006) Fatigue estimation with a multivariable myoelectric mapping function. IEEE Trans Biomed Eng 53: 694-700.
- Petrofsky J, Lind A (1980) Frequency analysis of the surface EMG during sustained isometric contractions. Eur J Appl Physiol 43: 173-182.
- Viitasalo J, Komi P (1978) Interrelationships of EMG signal characteristics at different levels of muscle tension during fatigue. J Electromyograph Clin Neurophysiol 18: 167-178.
- Zwarts M (1989) Evaluation of the estimation of muscle fiber conduction velocity: surface versus needle method. J Electromyograph Clin Neurophysiol 73: 544-548.
- Chang G, Kang W, Luh J, Cheng C, Lai J (1996) Real-time implementation of electromyogram pattern recognition as a control command of manmachine interface. J Med Eng Physiol 18: 529-537.
- Englehart K, Hudgin B, Parker P (2001) A wavelet-based continuous classification scheme for multifunction myoelectric control. IEEE Trans Biomed Eng 48: 302-311.
- Englehart K, Hudgins B, Chan A (2003) Evaluation of the estimation of muscle fiber conduction velocity: surface versus needle method. Continuous multifunction myoelectric control using pattern recognition. Technol Disabil 15: 95-103.
- Graupe D, Cline W (1975) Functional separation of EMG signals via ARMA identification methods for prosthesis control purposes. IEEE Trans Syst Man Cybernet SMC-5: 252-259.
- Hudgins B, Parker P, Scott R (1993) A new strategy for multifunction myoelectric control. IEEE Trans Biomed Eng 40: 82-94.
- Merletti R, Parker P (2004) Electromyography: Physiology, engineering and non-invasive applications. IEEE Press, New Jersey, USA. p: 520.
- Roy S, Casavant D, Emley M, Gilmore L, Luca CD (1988) EMG spectral analysis of muscle fatigue associated with chronic lower back pain. Boston, Massachusetts: IEEE Conf Eng Med Biol Soc pp: 1732-1733.
- Chan A, Englehart K, Hudgins B, Lovely D (2006) Multiexpert automatic speech recognition using acoustic and myoelectric signals. IEEE Trans Biomed Eng 53: 676-685.
- Dutta S, Ghosh D, Samanta S, Dey S (2014) Multifractal parameters as an indication of different physiological and pathological states of the human brain. Physica A 396: 155-163.
- Andrzejak RG, Lehnertz K, Mormann F, Rieke C, David P, et al. (2001) Indications of nonlinear deterministic and finite-dimensional structures in time series of brain electrical activity: Dependence on recording region and brain state. Phy Rev E 64: 061907.
- Andrzejak RG, Chicharro D, Lehnertz K, Mormann F (2011) Using bivariate signal analysis to characterize the epileptic focus: The benefit of surrogates. Phys Rev E Stat Nonlin Soft Matter Phys 83: 046203.
- Farina D, Merletti R, Nazzaro M, Caruso I (2001) Effect of joint angle on EMG variables in leg and thigh muscles. IEEE Mag Eng Med Biol 2001: 62-71.
- Kang W, Cheng C, Lai J, Shiu J, Kuo T (1996) A comparative analysis of various EMG pattern recognition methods. J Med Eng Physiol 18: 390-395.
- Del Santo F, Gelli F, Mazzocchio R, Rossi A (2007) Recurrence quantification analysis of surface EMG detects changes in motor unit synchronization induced by recurrent inhibition. Exp Brain Res 178: 308-315.
- Farina D, Fattorini L, Felici F, Filligoi G (2002) Nonlinear surface EMG analysis to detect changes of motor unit conduction velocity and synchronization. J Appl Physiol 93: 1753-1763.
- Filligoi G, Felici F (1999) Detection of hidden rhythms in surface EMG signals with a non-linear time-series tool. Med Eng Phys 21: 439-448.
- Ikegawa S, Shinohara M, Fukunaga T, Zbilut JP, Webber Jr CL (2000) Nonlinear time-course of lumbar muscle fatigue using recurrence quantifications. Biol Cybern 82: 373-382.
- Liu Y, Kankaanpaa M, Zbilut JP, Webber Jr CL (2004) EMG recurrence quantifications in dynamic exercise. Biol Cybern 90: 337-348.
- Grassberger P, Procaccia I (1983) Measuring the strangeness of strange attractors. Physica D 9: 189-208.
- Parker TS, Chua LO (1989) Practical numerical algorithms for chaotic systems. Springer-Verlag, New York, USA. pp: 193-194.
- Buczkowski S, Hildgen P, Cartilier L (1998) Measurements of fractal dimension by box-counting: A critical analysis of data scatter. Physica A 252: 23-34.
- Kim HS, Eykholt R, Salas JD (1999) Nonlinear dynamics, delay times and embedding windows. Physica D 127: 48-60.
- Eke A, Herman P, Kocsis L, Kozak LR (2002) Fractal characterization of complexity in temporal physiological signals. Physiol Meas 23: R1-R38.
- Sarkar M, Leong TY (2003) Characterization of medical time series using fuzzy similarity-based fractal dimensions. Artificial Intelligence in Medicine 27: 201-222.
- Mandelbrot BB (1977) Fractals: Form, chance, and dimension. W. H. Freeman and Company, San Francisco, USA. p: 365.
- Ghosh D, Deb A, Dutta K, Sarkar R, Dutta I, et al. (2004) Multifractality and multifractal specific heat in fragmentation process in 24Mg-AgBr interaction at 4.5 A GeV. Indian J Phys 78: 359-362.
- Anmuth CJ, Goldberg G, Mayer NH (1994) Fractal dimension of EMG signals recorded with surface electrodes during isometric contractions is linearly correlated with muscle activation. Muscle & Nerve 17: 953-954.
- Chang S, Hu SJ, Lin WC (2004) Fractal dynamics and synchronization of rhythms in urodynamics of female Wistar rats. J Neurosci Meth 139: 271-279.
- Chang S, Li SJ, Chiang MJ, Hu SJ, Hsyu MC (2007) Fractal dimension estimation via spectral distribution function and its application to physiological signals. IEEE Trans Biomed Eng 54: 1895-1898.
- Chang S, Mao ST, Hu SJ, Lin WC, Cheng CL (2000) Studies of detrusorsphincter synergia and dyssynergia during micturition in rats via fractional Brownian motion. IEEE Trans Biomed Eng 47: 1066-1073.
- Chang YC, Chang S (2002) A fast estimation algorithm on the Hurst parameter of discrete-time fractional Brownian motion. IEEE Trans Signal Process 50: 554-559.
- Chen W, Wang Z, Ren X (2006) Characterization of surface EMG signals using improved approximate entropy. J Zhejiang Univ 10: 844-848.
- Gitter J, Czerniecki M (1995) Fractal analysis of the electromyographic interference pattern. J Neurophysiol Meth 58: 103-108.
- Gupta V, Suryanarayanan S, Reddy N (1997) Fractal analysis of surface EMG signals from the biceps. Int J Med Inform 45: 185-192.
- Hu X, Wang Z, Ren X (2005) Classification of surface EMG signal with fractal dimension. J Zhejiang Univ 8: 844-848.
- Shields R (2006) Fractal dimension of the EMG interference pattern: preliminary observations and comparisons with other measures of interference pattern analysis. J Clin Neurophysiol 10: 117-118.
- Xu Z, Xiao S (1997) Fractal dimension of surface EMG and its determinants. Chicago, IL: IEEE Engineering in Medicine and Biology Conference. pp: 1570-1573.
- Katz M (1988) Fractals and the analysis of waveforms. Comput Biol Med 18: 145-156.
- Zhao J, Jiang L, Cai H, Liu H (2007) EMG pattern recognition method for prosthetic hand based on wavelet transformand sample entropy. Control and Decision 22: 927-930.
- Naik G, Kumar D, Arjunan S (2009) Use of SEMG in identification of low level muscle activities: Features based on ICA and fractal dimension. In: Proc Ann Int Conf IEEE Eng Med Biol Soc pp: 364-367.
- Dang KTQ, Minh HL Thanh HN, Van TV (2012) Analyzing surface EMG signals to determine relationship between jaw imbalance and arm strength loss in BioMedical Engineering 11: 55.
- Zhang D, Zhao X, Han J, Zhao Y (2014) A comparative study on PCA and LDA Based EMG pattern recognition for anthropomorphic robotic hand. In: IEEE International Conference on Robotics & Automation (ICRA), Hong Kong Convention and Exhibition Center, May 31 - June 7, 2014, Hong Kong, China.
- Naeem SM, Seddik AF, Eldosoky MA (2014) New technique based on uterine electromyography nonlinearity for preterm delivery detection 6: 107-114.
- Gang W, Xiao-Mei R, Lei L, Zhi-Zhong W (2007) Multifractal analysis of surface EMG signals for assessing muscle fatigue during static contractions. J Zhejiang Univ Sci A 8: 910-915.
- Naik GR, Kumarand DK, Arjunan SP (2011) Applications of ICA and fractal dimension in SEMG signal processing for subtle movement analysis: A review. Australas Phys Eng Sci Med 34: 179-193.
- Phinyomark A, Limsakul C, Phukpattaranont P (2009) A novel feature extraction for robust EMG pattern recognition. Journal of Computing 1: 71-80.
- Phinyomark A, Phukpattaranont P, Limsakul C (2012) Fractal analysis features for weak and single-channel upper-limb EMG signal. Exp Sys Appl 39: 11156-11163.
- Xiao H, Zhi-Zhong W, Xiao-Mei R (2005) Classification of surface EMG signal with fractal dimension. J Zhej Univ Sci B 6: 844-848.
- Arjunan SP, Kumar DK (2007) Fractal theory based Non-linear analysis of SEMG. In: 3rd International Conference on Intelligent Sensors, Sensor Networks and Information, 3-6 Dec 2007, Melbourne, Qld, Australia.
- Arjunan SP, Kumar DK (2014) Computation of fractal features based on the fractal analysis of surface electromyogram to estimate force of contraction of different muscles. Comput Methods Biomech Biomed Eng 17: 210-216.
- Kantelhardt HW, Zschiegner SA, Koscielny BE, Havlin S, Bunde A, et al. (2002) Multifractal detrended fluctuation analysis of nonstationary time series. Physica A 316: 87-114.
- Telesca L, Lapenna V, Macchiato M (2004) Mono- and multi-fractal investigation of scaling properties in temporal patterns of seismic sequences. Chaos Soli Fract 19: 1-15.
- Telesca L, Lapenna V, Macchiato M (2005) Multifractal fluctuations in earthquake-related geoelectrical signals. New J Phys 7: 214-15.
- Movahed MS, Jafari GR, Ghasemi F, Rahvar S, Rahimi TMR (2006) Multifractal detrended fluctuation analysis of sunspot time series. J Stat Mech P02003.
- Niu MR, Zhou WX, Yan ZY, Guo QH, Liang QF, et al. (2008) Multifractal detrended fluctuation analysis of combustion flames in four-burner impinging entrained-flow gasifier. Chem Eng J 143: 230-235.
- Shang P, Lu Y, Kamae S (2008) Detecting long-range correlations of traffic time series with multifractal detrended fluctuation analysis. Chaos Soli Fract 36: 82-90.
- Lan TH, Gao ZY, Ahmed NA, Cheng B, Wang S (2008) Detrended fluctuation analysis as a statistical method to study ion single channel signal. Cell Biol Int 32: 247-252.
- Yuan Y, Zhuang XT, Jin X (2009) Measuring multifractality of stock price fluctuation using multifractal detrended fluctuation analysis. Physica A 388: 2189-2197.
- McArthur L, Mackenzie S, Boland J (2013) Multifractal analysis of wind farm power output. In: 20th International Congress on Modeling and Simulation (MODSIM 2013), Adelaide, Australia, 1 - 6 December 2013. pp: 420-426.
- Ghosh D, Dutta S, Chakraborty S (2014) Multifractal detrended cross-correlation analysis for epileptic patient in seizure and seizure free status. Chaos Soli Fract 67: 1-10.
- Kantelhardt JW, Rybski D, Zschiegner SA, Braun P, Bunde EK, et al. (2003) Multifractality of river runoff and precipitation: comparison of fluctuation analysis and wavelet methods. Physica A 330: 240-245.
- Ashkenazy Y, Havlin S, Ivanov PC, Peng CK, Frohlinde VS, et al. (2003) Magnitude and sign scaling in power-law correlated time-series. Physica A 323: 19-41.
- Parisi G, Frisch U (1985) Turbulence and predictability in geophysical fluid dynamics and climate dynamics. Elsevier Science Ltd. 1985.
- Ashkenazy Y, Hausdroff JM, Ivanov PC, Stanley HE (2002) Stochastic model of humain gait dynamics. Physica A 316: 662-670.
- Shimizu Y, Thurner S, Ehrenberger K (2002) Multifractal spectra as a measure of complexity in human posture. Fractals 10: 103-116.
- Ashkenazy Y, Baker DR, Gildor H, Havlin S (2003) Nonlinearity and multifractality of climate change in the past 420,000 years. Geophys Res Lett 30: 2146-2149.
- Kantelhardt JW, Koscielny BE, Rego HHA, Havlin S, Bunde A (2001) Detecting long-range correlations with detrended fluctuation analysis. Physica A 295: 441-454.
- Movahed S, Hermanis E (2008) Fractal analysis of river flow fluctuations (with Erratum). Physica A 387: 915-932.
- Serrano E, Figliola A (2009) Wavelet leaders: A new method to estimate the multifractal singularity spectra. Physica A 388: 2793-2805.
- Huang XY, Schmitt FG, Hermand JP, Gagne Y, Lu ZM (2011) Arbitrary-order Hilbert spectral analysis for time series possessing scaling statistics: comparison study with detrended fluctuation analysis and wavelet leaders. Phys Rev E Stat Nonlinear Soft Matter Phys 84: 016208-016213.
- Oswiecimka P, Kwapien J, Drozdz S (2006) Wavelet versus detrended fluctuation analysis of multifractal structures. Phys Rev E 74: 06103-06137.
- Ma QDY, Bartsch RP, Bernaola-Galván P, Yoneyama M, Ivanov PC (2010) Effect of extreme data loss on long-range correlated and anticorrelated signals quantified by detrended fluctuation analysis. Phys Rev E 81: 031101.
- Chhabra A, Jensen RV (1989) Direct determination of the f(α) singularity spectrum. Phys Rev Lett 62:1327- 1330.
- Lindstrom L, Kadefors R, Petersen I (1977) An electromyographic index for localized muscle fatigue. J Appl Physiol Resp Environ Exerc Physiol 43:750-754.
- Stulen FB, De Luca CJ (1981) Frequency parameters of the myoelectric signal as a measure of muscle conduction velocity. IEEE Trans on Biomed Eng 28:515-523.
- Talebinejad M, Chan ADC, Miri A, Dansereau RM (2009) Fractal analysis of surface electromyography signals: A novel power spectrum-based method. J Electromyogr Kinesiol 19: 840-850.